Save the date! Registration opens July 17.
Annual Meeting: Dec. 1–5, 2024
Technical Exhibits: Dec. 1–4, 2024
Annual Meeting
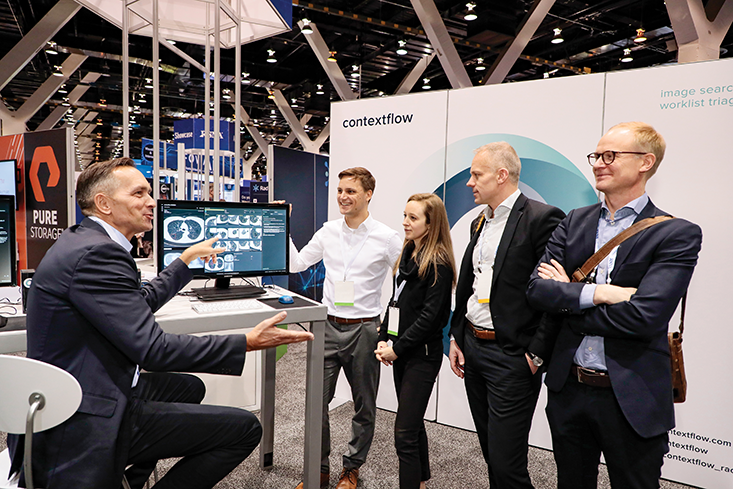
RSNA 2024: Building Intelligent Connections
RSNA 2024 will center on the bright horizon of radiology and the important role AI plays in empowering radiologists into the future. Make plans to join us in Chicago from Dec. 1–5 as we explore how to intentionally and intelligently build the right connections between people and technology.
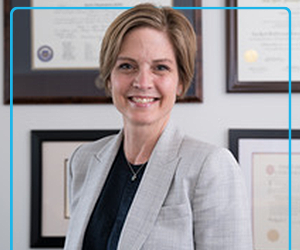
Meet the RSNA 2024 plenary speakers

Nina Kottler, MD, MS
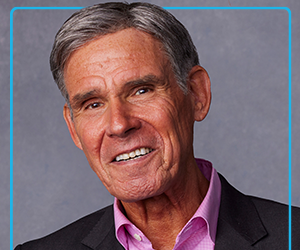
Eric Topol, MD


Reserve your hotel with us
When you reserve your hotel through RSNA, you’ll get discounted rates at nearly 60 hotels in addition to a variety of other valuable benefits.
There’s still time to access RSNA 2023
Revisit your favorite moments of RSNA 2023 or catch up on what you missed with Virtual Access! Use Meeting Central to view sessions on demand with nearly 100% of all RSNA 2023 programming available until April 30, 2024, noon CT.
Exhibitor resources
Explore the variety of essential resources we’ve put together to help you maximize your success and plan your RSNA 2024 exhibit.
Future meeting dates
Discover the dates of future RSNA annual meetings and browse important materials and highlights from recent conferences.